Dashboards
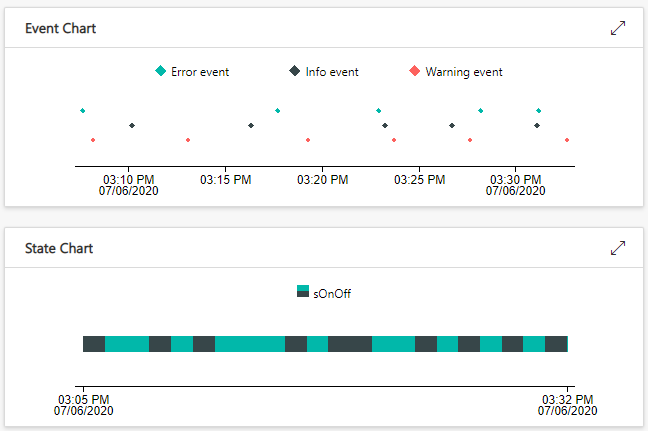
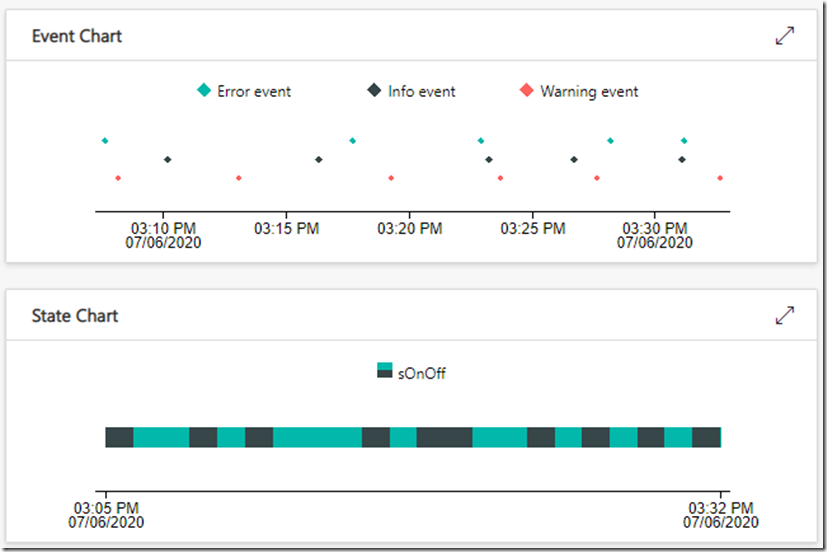
Dashboards now support visualizations for Event and State telemetry. Event charts display a bulleted timeseries to visualize when events occurred from one or more devices. State charts show bars on a timeline representing the duration of states for the selected device(s). To use these charts, add an Event or State telemetry tile, and change the visualization to select Event chart or State chart.
New About page
The About page shows relevant information about your app that's useful when:
- Contacting support.
- Reviewing your billing information.
- Using the REST API.
- Adding a connector.
View last data received timestamp
The Device details page now shows the most recent timestamp a device sent telemetry or a property message. This helps to diagnose if a device is connected and able to send data to the application.
Making IoT Central accessible
Several lists in IoT Central now have a design that's more accessible to customers using keyboards and screen readers. We're also working on improvements to our design and engineering processes to ensure we build an experience that's accessible to everyone.
Device developer documentation improvements