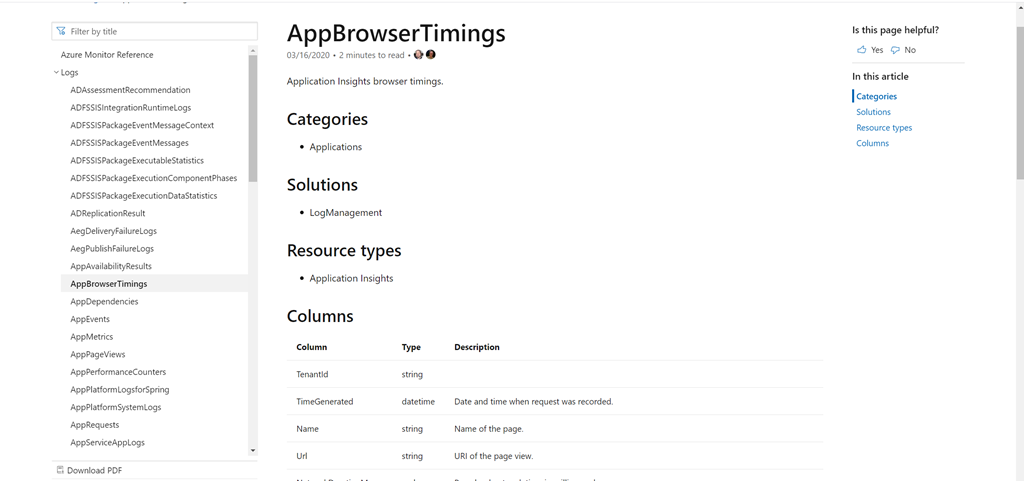
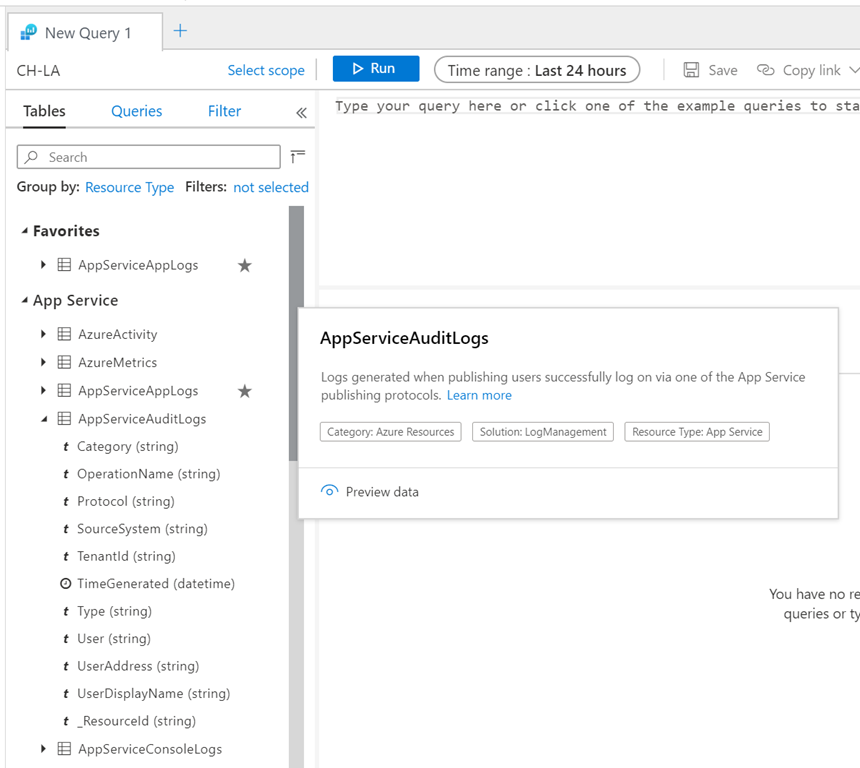
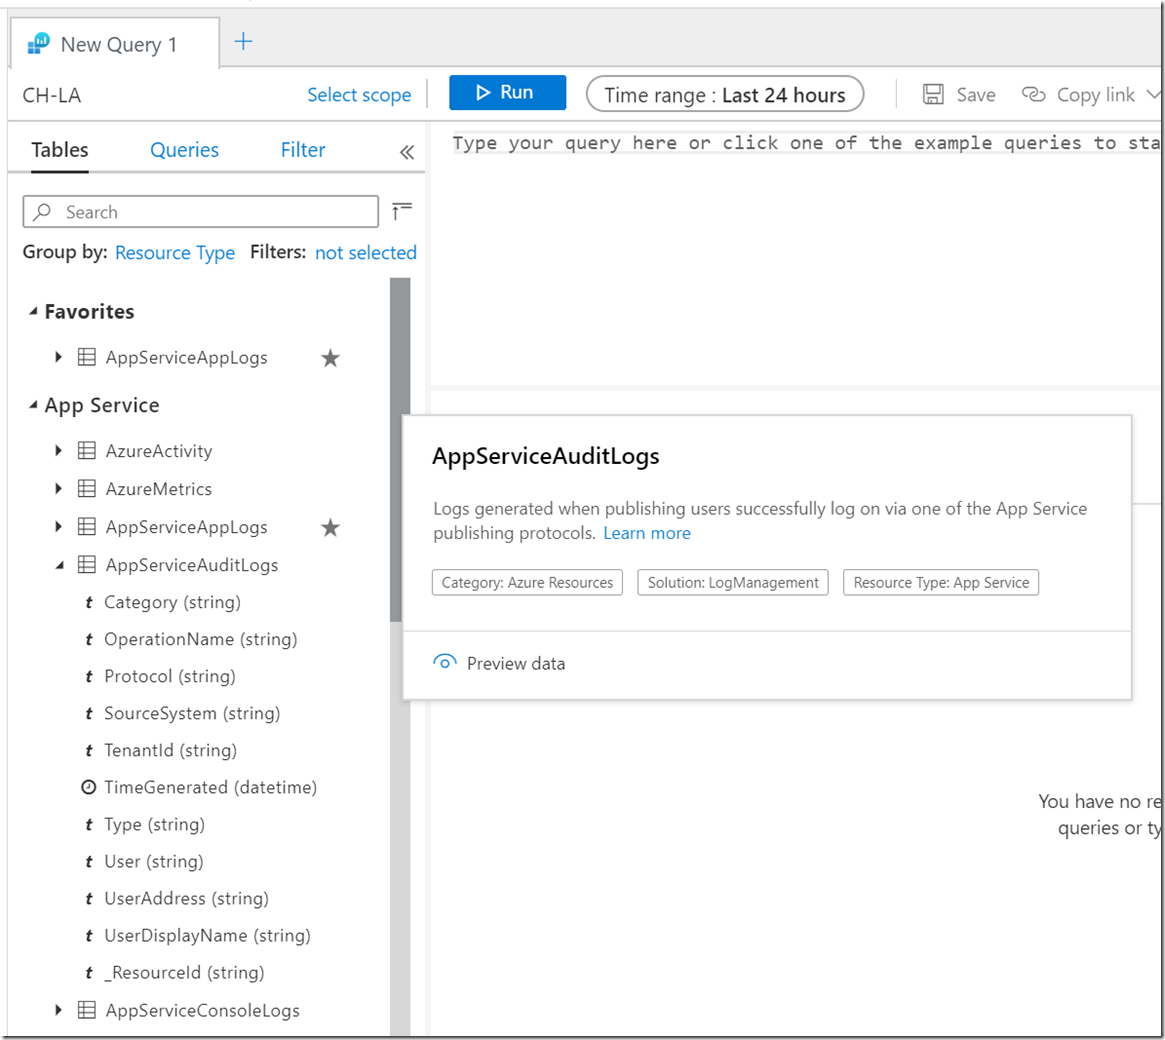
Significant enhancements have been made to the tables side-pane experience, improving how Azure Monitor Logs organizes and displays tables. For example, there’s now a dedicated documentation page for Monitor Logs schemas. Each table has its own documentation page providing insight into the table, where its used, and its columns.
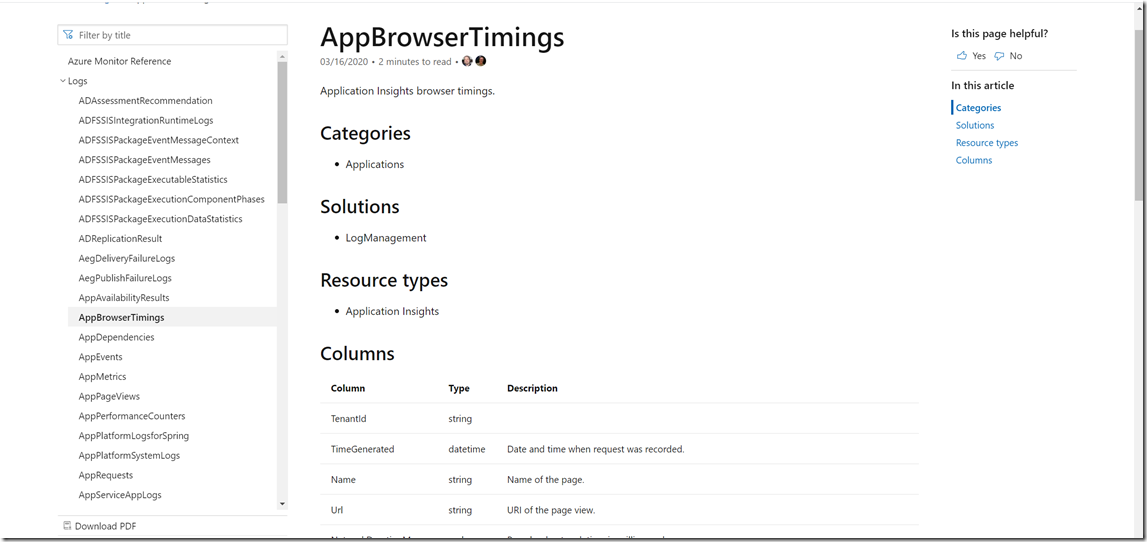
There's also a link to this documentation right from the table’s description in Azure Monitor Logs. Read the reference documentation.
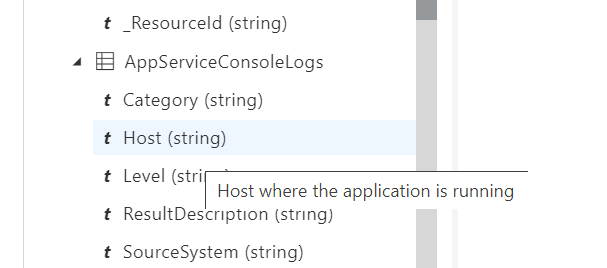
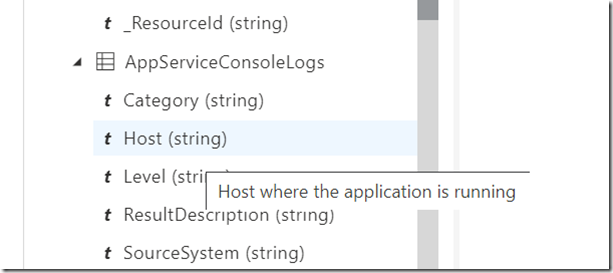
In addition, column descriptions are also now available. Simply hover over a column to see its description.
Let us know your feedback and we'll continue to improve the experience based on your requests and suggestions.