Azure Monitor Logs connector lets you query data in your Log Analytics workspace or Application Insights components per Logic App trigger or schedule, and list or visualize results. The Time range property in the connector provides filtering for query execution scope and relevant results, and up to now, could be either Set in query when time filter appears in query, or set with relative value such as last hour, last 12 hour, etc..
The Time range in Azure Monitor Logs connector (preview) includes Exact time range option to let you pass the start-time and end-time dynamically, and satisfy scenarios such as alert diagnosis - When connector is triggered by alert, Azure Monitor Logs connector can be provided with the alert’s time range dynamically, to replicate the results triggered the alert and allow effective investigation.
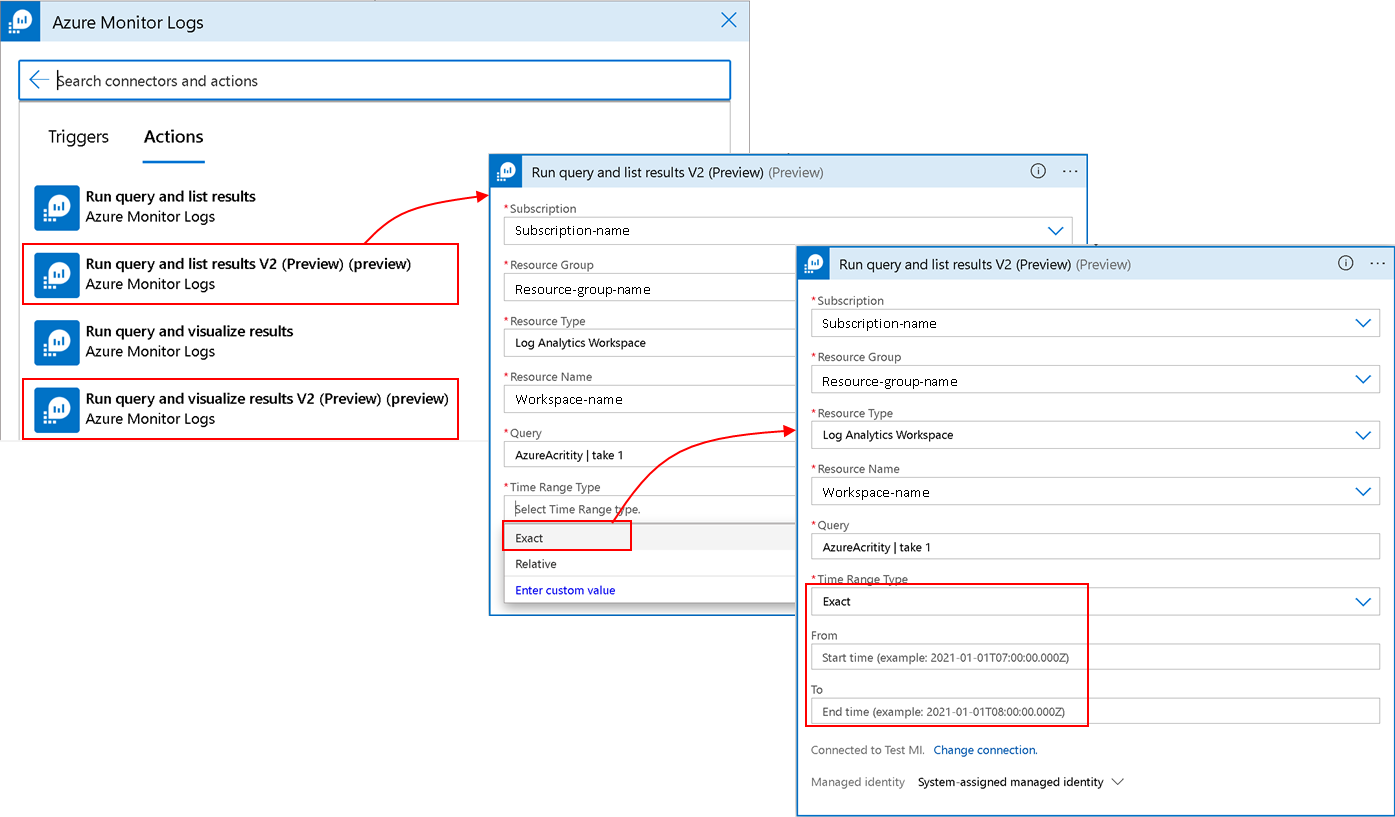
See Azure Monitor Logs connector.