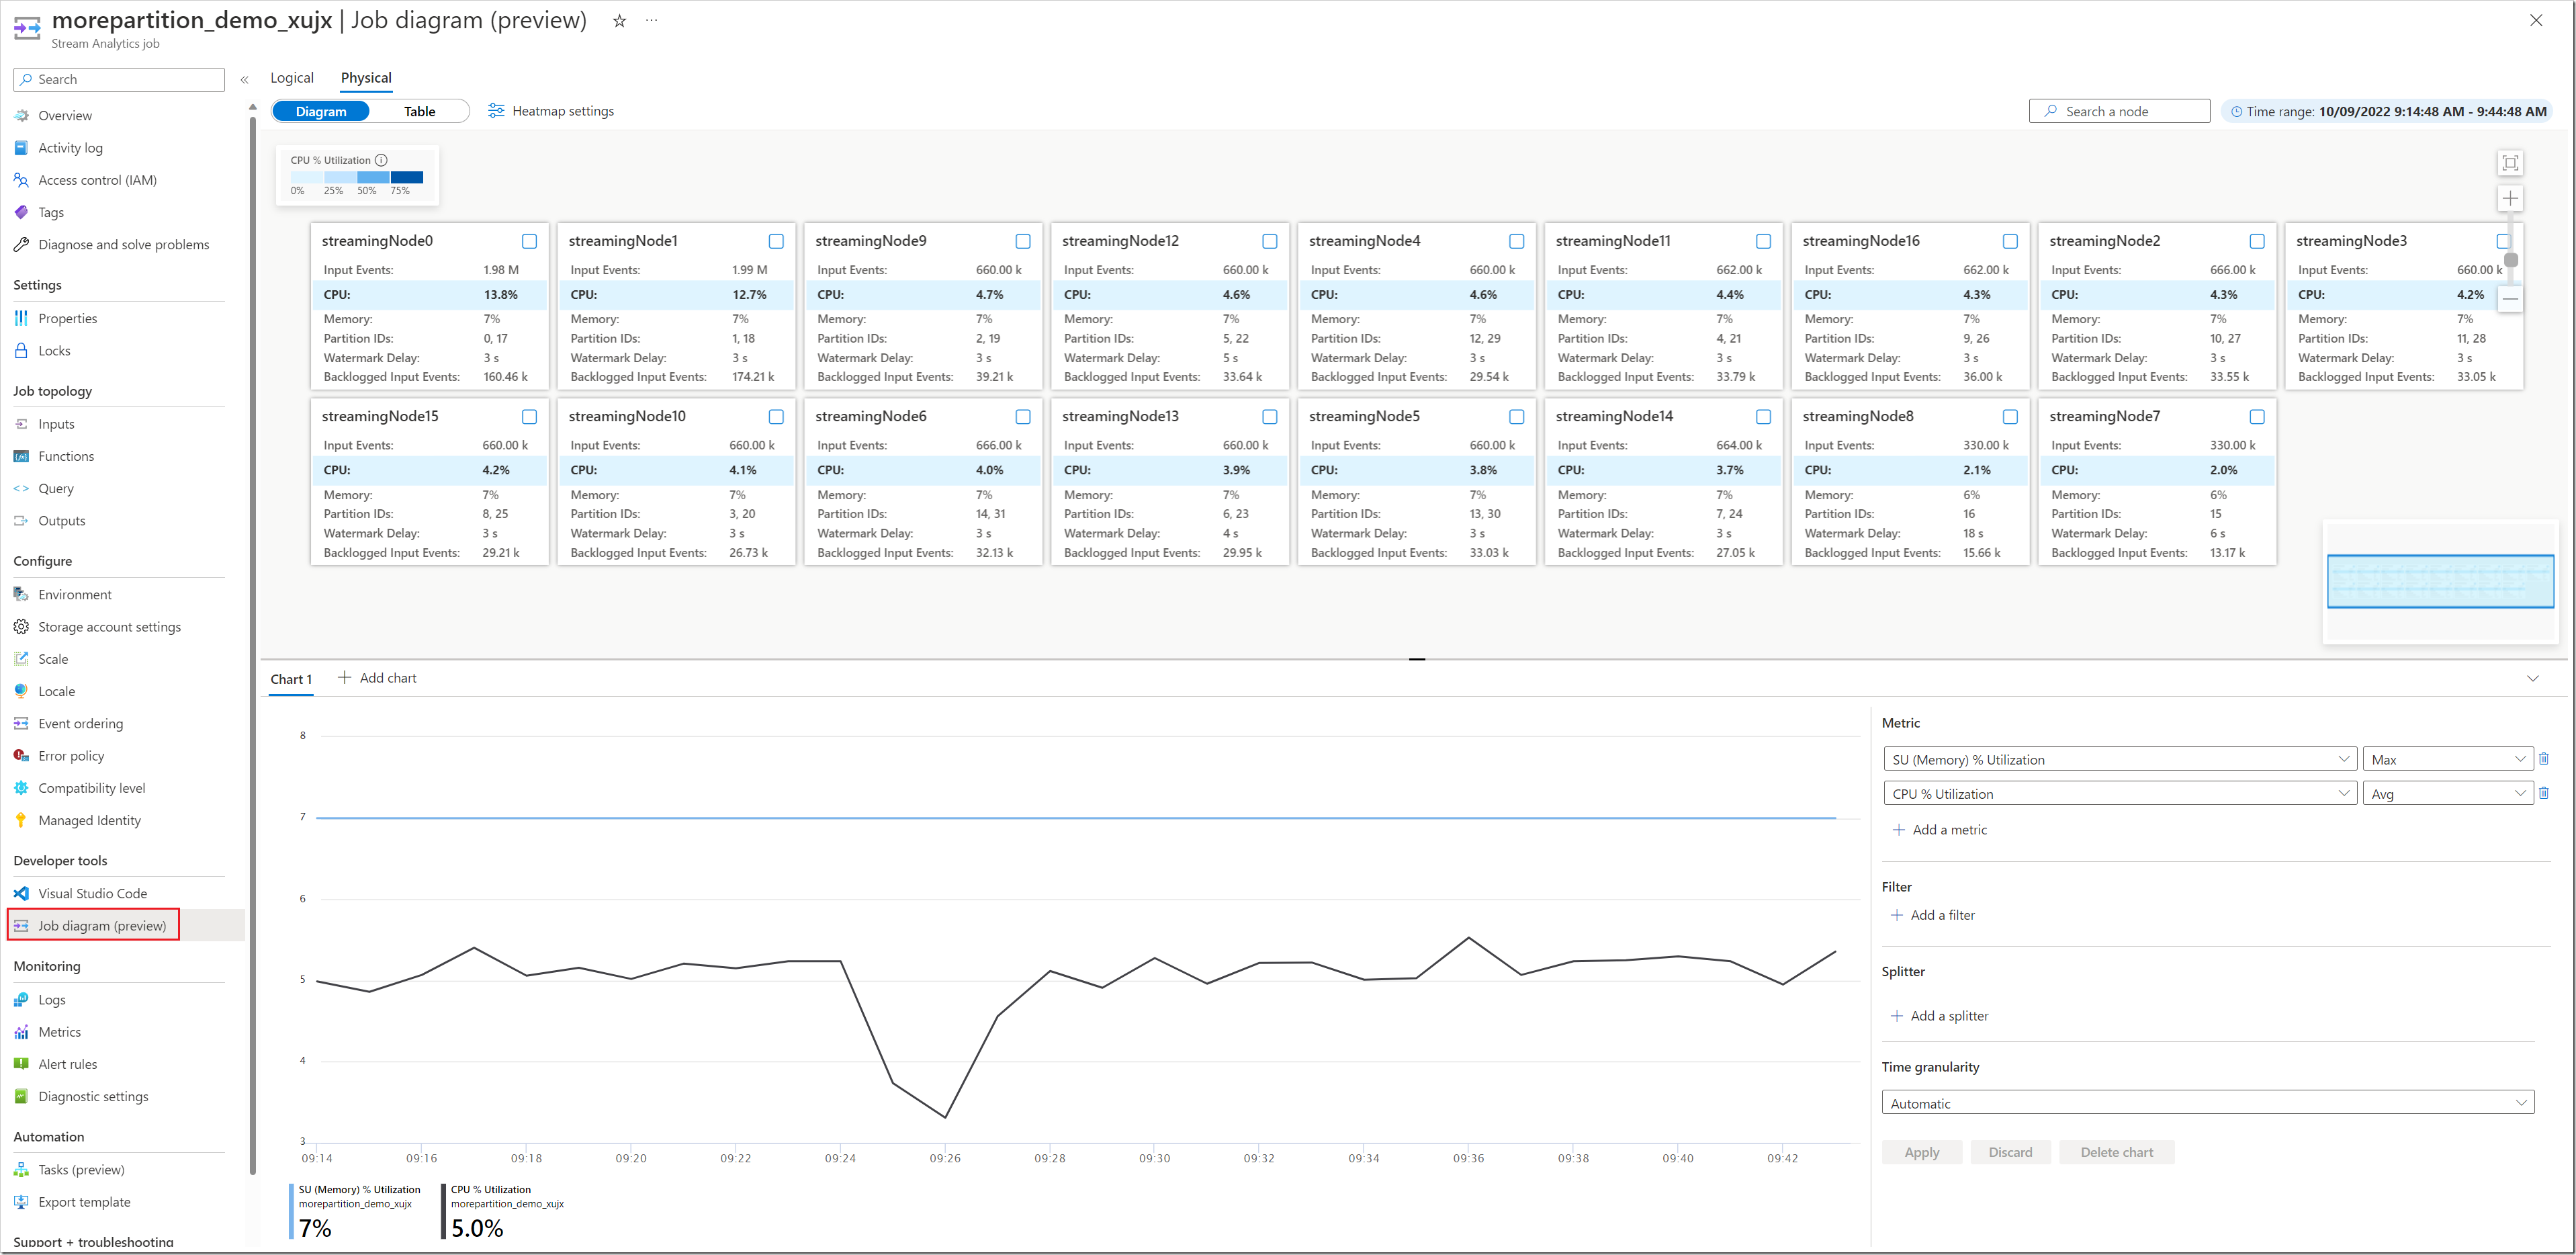
Stream Analytics physical job diagram visualizes your job’s key metrics with streaming node in diagram and table format: CPU utilization, memory utilization, input events, partition IDs, backlogged input events, and watermark delay. You can check the job’s historical metrics data with different types of metrics, filters, and splitters. With the diagram, it helps you quickly identify if your job is running in parallel with the diagram and locate the bottlenecks (hottest streaming node that impacts your job’s performance) by ordering the streaming nodes with selecting one metric from CPU/memory Utilization, Input Events, Backlogged Input Events, and Watermark delay. And then take corrective actions.
You can learn more about the physical job diagram and how to use it to debug your job.